Peratt Instabilities, Plasma Columns, Z-Pinch. The Axis Mundi.
Anthony Peratt published two papers which are relevant for this site. One on December 2003 called Characteristics for the Occurrence of a High-Current, Z-Pinch Aurora as Recorded in Antiquity (IEEE Transactions on Plasma Science, Vol 31, № 6), and another on August 2007 called Characteristics for the Occurrence of a High-Current Z-Pinch Aurora as Recorded in Antiquity Part II: Directionality and Source (IEEE Transactions on Plasma Science, Vol 35, № 4) both available in PDF below.
I encourage you to read them carefully, as well as to familiarize yourself as much as possible with plasma. If not the math, at least the concepts.
I will be quoting some relevant fragments and (mostly all) figures, because this website is largely a compilation of artefacts that morphologically resemble those plasma instabilities described in this paper. Of course this does not imply that the architects of the Bayterek tower in Astana, Kazakhstan, saw anything like that in the sky, despite having such striking similarity with the auroral funnel in fig. 4. Nor the designers of the World Cup trophy for that matter.
Worldwide creation myths include the first light (and sound, or voice), the separation of sky and earth, a column raising to the sky, the sacred mountain, or the sacred tree, where gods lived… The first oral and then written accounts of that “Sacred Time” that have arrived us present many problems. Oral transmission is subject to change from generation to generation. Language itself is also subject to change. While this means that many details between two accounts of the same story will necessarily differ, it still allows us to identify enough key elements between them to establish that they might share a similar origin or experience. The Kalevala, the national epic of the Finns, was compiled into written form only very recently (19th century) by Elias Lönnrot:
The happy result of his travels throughout Finland, Dr. Lönnrot now commenced to arrange under the central idea of a great epic, called Kalevala, and in February, 1835, the manuscript was transmitted to the Finnish Literary Society, which had it published in two parts. Lönnrot, however, did not stop here; he went on searching and collecting, and, in 1840, had brought together more than one thousand fragments of epical poetry, national ballads, and proverbs. These he published in two works, respectively entitled, Kanteletar (Lyre-charm), and The Proverbs of the Suomi People, the latter containing over 1700 proverbs, adages, gnomic sentences, and songs.
Preface to The Kalevala, translated by John Martin Crawford
Peratt proposed that many petroglyphs, that is, pictures carved on rock, might have been actual depictions of things seen in the sky by the inhabitants of every continent except Antarctica. For his paper he compared a data bank containing several tens of thousands of digital petroglyph photographs approximately between 10,000 and 2,000 BCE with the dynamics of intense auroras and pictures of laboratory-generated plasma columns. Because plasma behaviour can be scaled across many orders of magnitude, we can use small scale models to replicate earth sized effects.
Petroglyphs have not changed since they were made. If any of them was depicting anything accurately, it still is. That’s an advantage compared to language. However, and because they lack any understandable grammar, their ability to tell a story, a sequence of events, is almost null, at least individually.
If it is true that great things were seen and experienced coming from the skies (with understandable terror, if so), I am of the opinion that people began to animalize or humanize celestial events, or forces, or things, when they ceased to be seen. Thus, those petroglyphs could very well be natural depictions. Of course carving stone makes the accurate depiction of glowing gases or intricate tendrils quite a difficult task. And the spirit would have been more visceral than academic, I am convinced. However, to describe the general structure it’s just fine.
This website is meant to be a visual thing more than a verbal one. So let’s move on to the beef.
Part One
From IEEE Transactions on Plasma Science, Vol 31, № 6, December 2003.
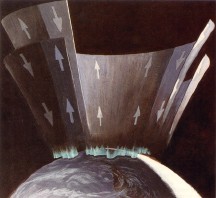
Fig. 2. Artists depiction of Birkeland currents flowing into and out of the earth’s atmosphere at high latitude. These currents, once the subject of intense debate, are routinely measured by today’s satellites and have total magnitudes of millions of amperes (megaamperes). Courtesy of S. G. Smith, Applied Physics Laboratory, The Johns Hopkins University.
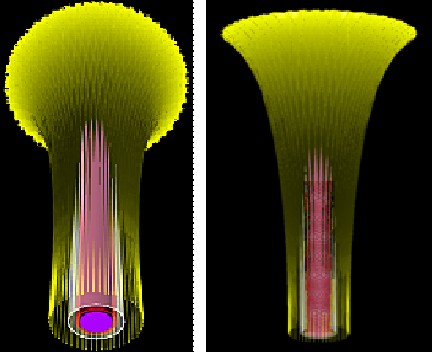
Fig. 4. Depiction of an intense auroral funnel. The figures show both downflowing and up-flowing Birkeland currents contained with two Concentric sheets. (Left) Oblique upward view. (Right) Side view. Barely discernible at the lower center are the Z-pinch instabilities.
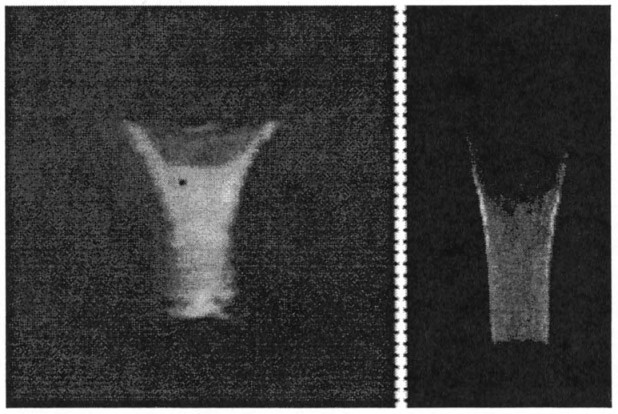
Fig. 5. Conical inflow of a current conducting plasma column. The flow is from top to bottom with striations in the body of the column, and the beginning of a plasma feature at top-center. These experimental photographs pertain to a 5 MV, 3 MA plasma.
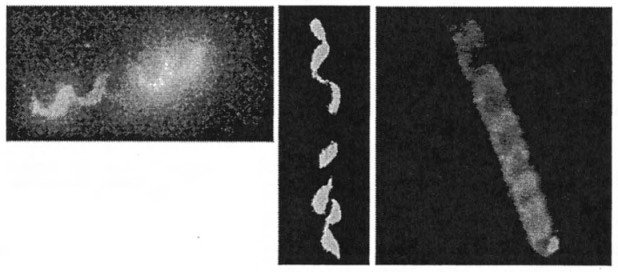
Fig. 6. Helical instabilities in the laboratory and space. (Left) 1.3-MA plasma column. (Middle) Centimeter-length plasma column conducting 2 MA. Framing camera picture, 5 ns (5 billionths of a second). (Right) Ten-kilometer, 150-mA electron current injected approximately 100 km above the earth.
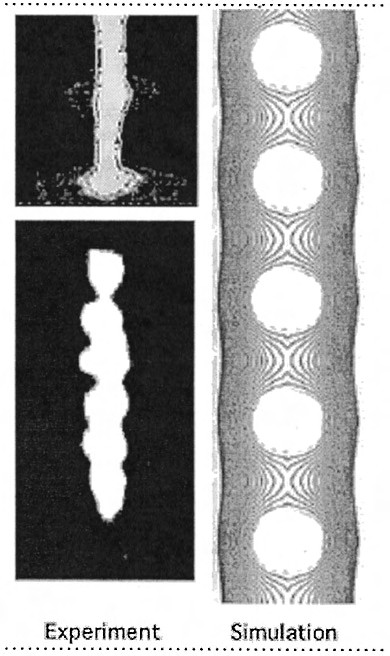
Fig. 7. Outer spheroids produced by the plasma pinch. (Top Left) Experimental, early time. (Bottom Left) Later time. (Right) MHD supercomputer graphical solution of the Chandraskhar–Fermi equations.
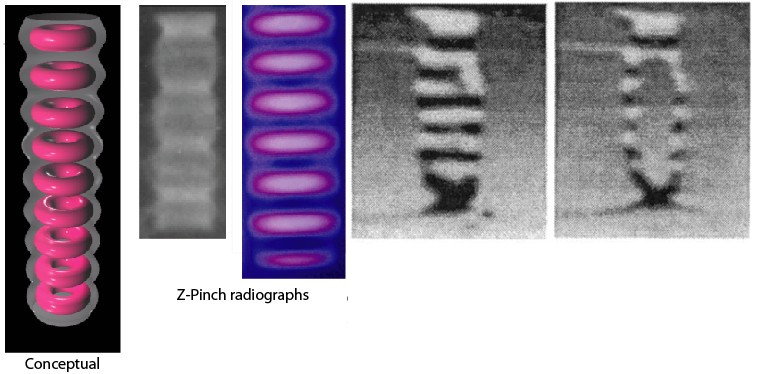
Fig. 8. Inner toroids within the stack of spheroids produced in a multi-megaampere plasma column. (a) Basic geometry. (b) Centimeter-size 1.3-MA pinch. (c) Centimeter-size 6-MA pinch. (d) Centimeter-size 6–MA pinch with optically dense (brightest) plasma shown.
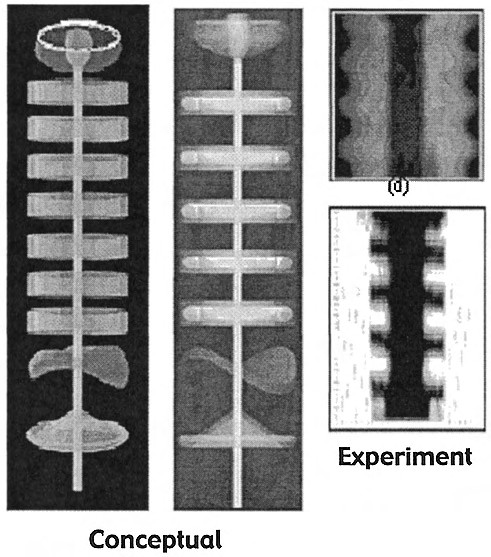
Fig. 9. (Left) Illustrations of simulations of the flattening of a stack of multimegaampere conducting plasma toroids. The current causes the toroids to both flatten out in the center and start to warp and fold at the ends as shown. (Right) X-ray radiograph of a l6-MA pinched plasma 4 cm in diameter.
(Top) Plasma sinusoidal pinch perturbation at 6.5 µs. (Bottom) Formation of flattened toroids from the initial ripples at 9.5 µs. The bottom figure rungs appear cutoff, but are the natural shape. (Los Alamos Plasma Physics, P-24).
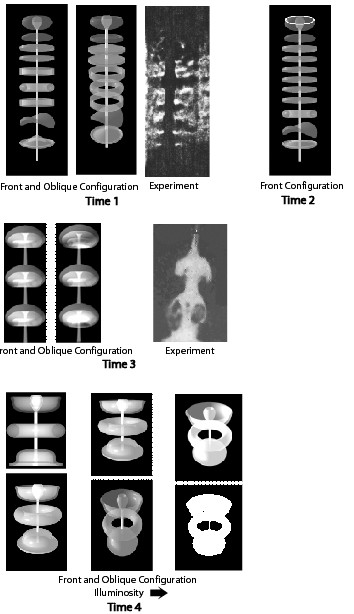
Fig. 10. Radiography derived time sequence of a multimegaampere stack of toroids in the highly nonlinear instability phase. The sequence shown starts from a previous nonlinear phase where the pinch ripples on the outer surface have collapsed into squared, folded and warped toroids. Figures derived from a few selected laser shadographs and schlieren photos. Time proceeds from left to right and top to bottom.
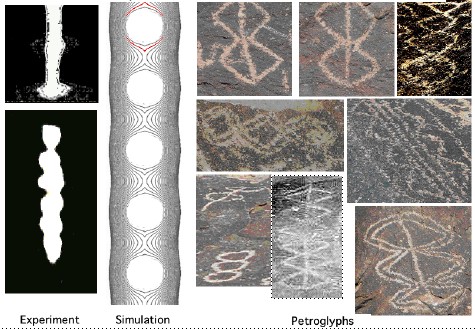
Fig. 16. Pinch instability characteristics of a plasma column. (Left) Plasma light photographs, early time. (Middle) Graphical solution of the Chandasekhar–Fermi equations. (Right) Petroglyphs. The patterns are found world-wide.
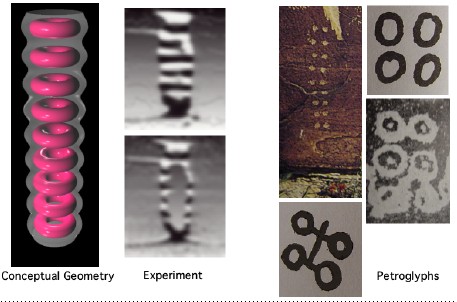
Fig. 17. Conceptual geometry of a stack of nine plasmoids produced in a high-current plasma column. (Left) Experimental and conceptual data of a stack of toroids along the pinched plasma column. (Right) Petroglyphs depicting stacked toroids. Note that the double row of dots numbers nine, the exact number of toroids generally produced in a plasma pinch.
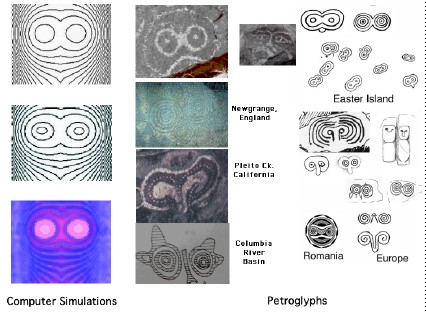
Fig. 18. Eye and nose masks. (Left) Isophotes from a portion of the graphical solution of the Chandrasekhar–Fermi equations. (Right) Eye mask and prominent nose petroglyphs.
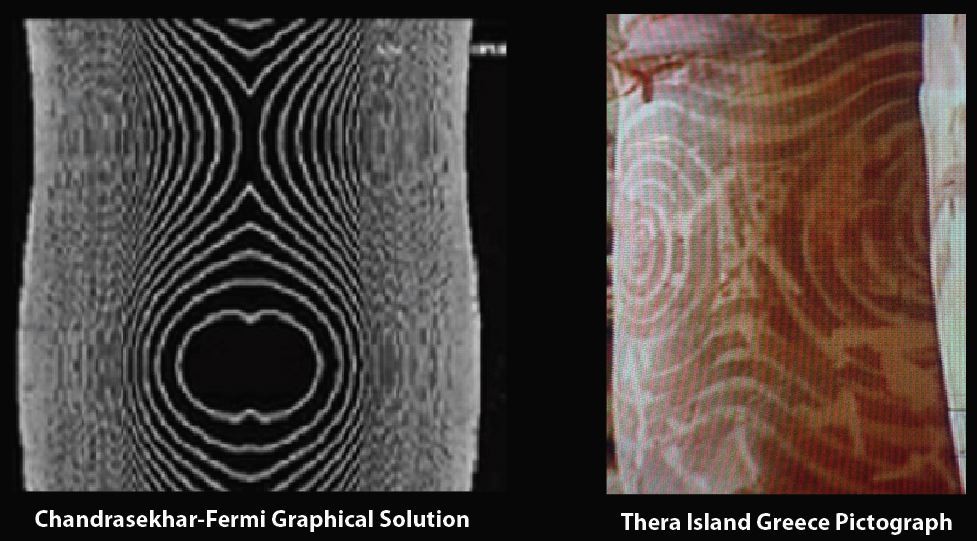
Fig. 19. Face masks as collected from various locations on Earth. The figure at the top left is a portion of the graphical solution of the Chandrasekhar–Fermi equations.
Fig. 21. Separatrix Patterns as collected from various locations on Earth. The figure at the upper left is a portion of the graphical solution of the Chandrasekhar–Fermi equations.
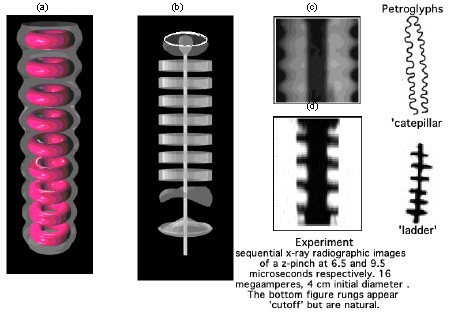
Fig. 22. (a) and (b) Conceptual geometries of a stack of multimegaampere current conducting plasma toroids. The current is increasing from left to tight, causing the toroids to both flatten out in the center and start to warp and fold at the ends as shown in (b). (c) Initial plasma sinusoidal pinch perturbation. (d) TPSO 136 2 late-time 16-MA current induced plasma ladder. The corresponding petroglyphs analogies are shown to the far right.
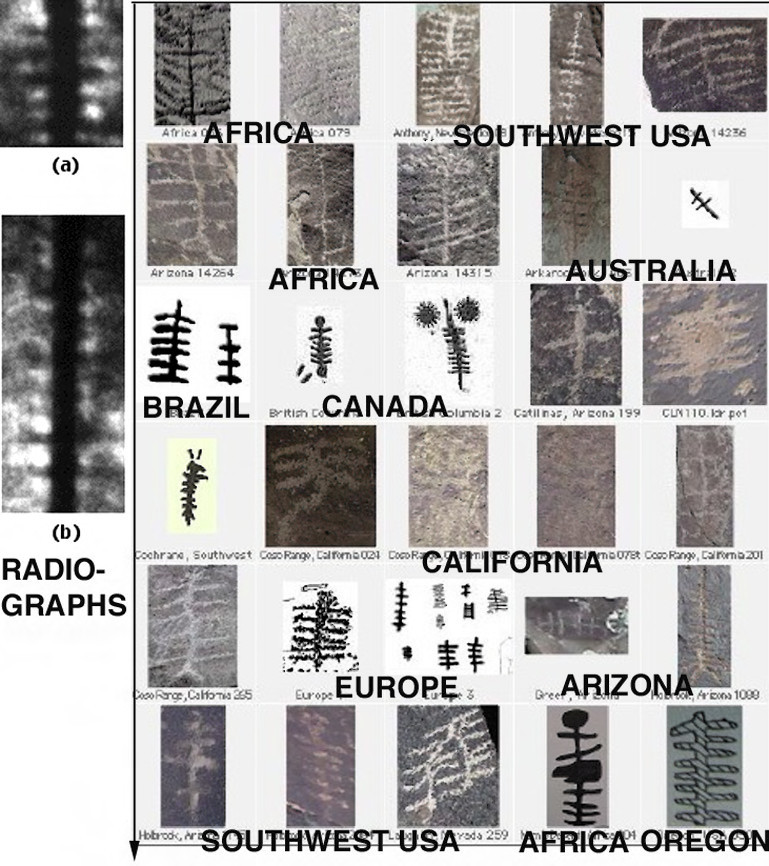
Fig. 24. (Left) Laser shadowgrams of plasma instabilities. (a) Stack of flattened toroids. (b) Later time shadowgram. The tips of the flattened toroids have started to curl in and form vortices. (Right) Collection of ladder category petroglyphs.
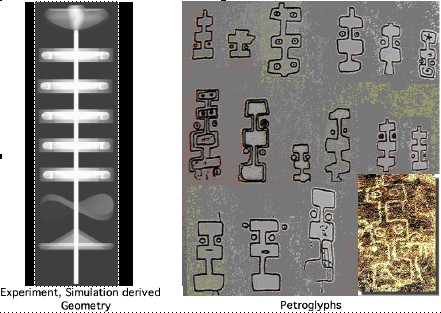
Fig. 26. (Left) Morphology and radiation properties of a stack of toroids beginning to undergo intense pressures from neighboring toroids. (Right) Pipette petroglyphs.
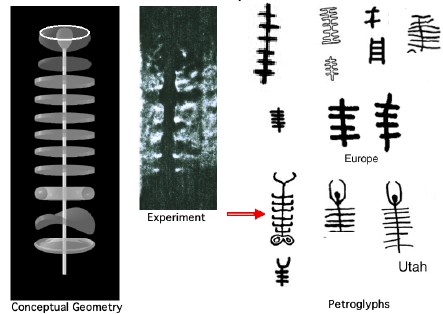
Fig. 27. (Left) Conceptual geometry and experimental laser shadowgraph of an intense current-conducting toroidal stack.
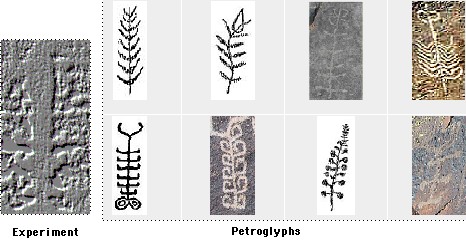
Fig. 28. (Left) Laser back-illuminated plasma pinch. The photograph has been digitally stratified to bring out the curling of the edges of the bottom, flattened toroids. The cathode is at the top. (Right) Sample collection of petroglyphs showing the transition from the ladder phase of the instability to toroid vortices. (Left to right, top to bottom). The examples shown have been collected from several parts of the world.
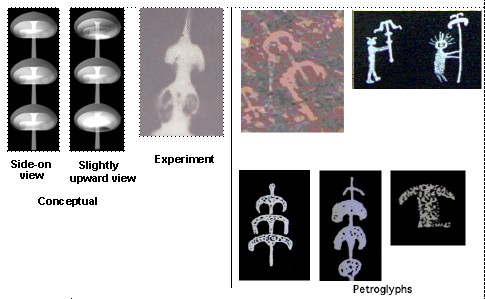
Fig. 29. (Left) Vortex formation in sub and multimegaampere pinched plasma columns. (Right) Petroglyphs.
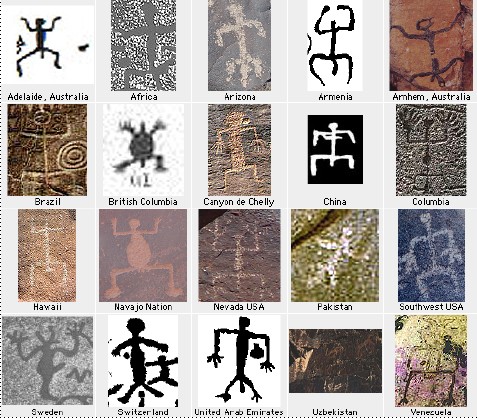
Fig. 30. Commonality of the most often depicted petroglyph, the squatter human or anthromorph.
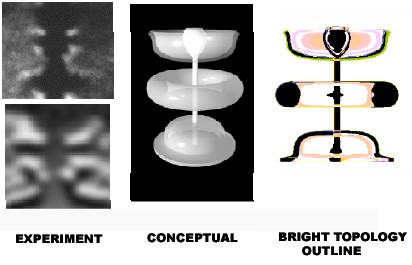
Fig. 31. (Left) Plasma instability profiles for a pulse illuminated section of a plasma column. Laser shadowgrams. (Right) Experimental and simulation derived geometries for extreme plasma currents in a plasma column. The illumination is strongest where the plasma is dense, that is, along the edges of the figures below and the cross-section of the center toroid.
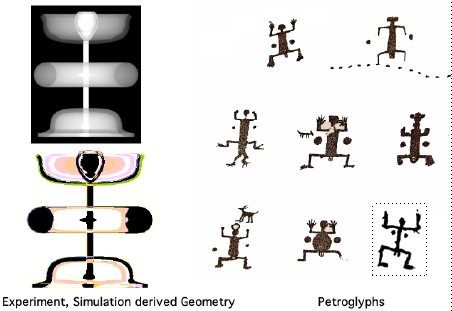
Fig. 32. (Left) Configuration and cross-sectional views of the intense current discharge. (Right) Petroglyphs. All are from the Western U.S. except the lower right figure that is from the United Arab Emirates.
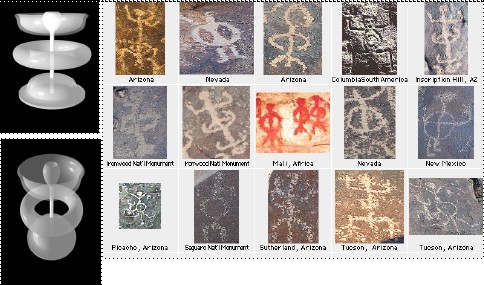
Fig. 33. (Left) Configuration and cross-sectional views of the intense current discharge as viewed obliquely to the plasma column. At times, two or more toroids are seen in line-of-sight emission. (Right) Petroglyphs.
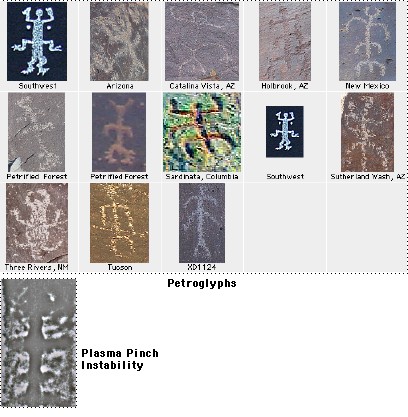
Fig. 34. (Bottom) Plasma pinch instability. When multikiloamperes or megaamperes of current flow though the plasma column, the flattened toroids both flatten and warp. (Top) Petroglyphs representative of the warping phenomena, for example, in the “belly” of the “squatter” men shown.
Comment for figs. 33 etc.: I think the oblique visualizations should be seen from below instead of from above.
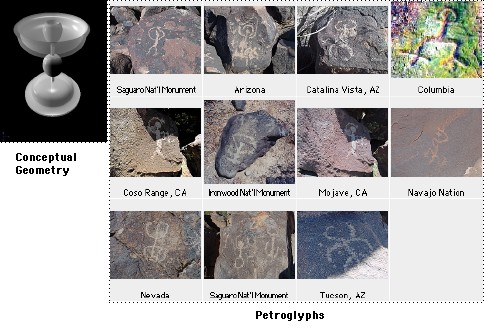
Fig. 35. (Left) View of the intense current discharge as viewed obliquely to the plasma column. (Right) Figures clearly depict the cup top-most terminus.
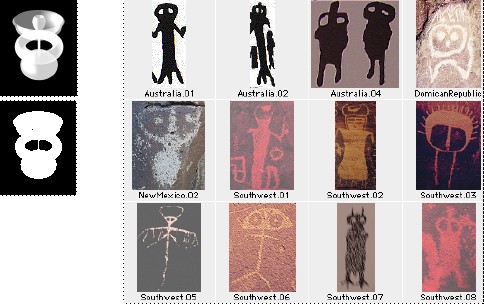
Fig. 36. (Left) Bright plasma instabilities, top to bottom, increasing luminance. (Right) Petroglyphs. Some show the entire body including the trifurcated base.
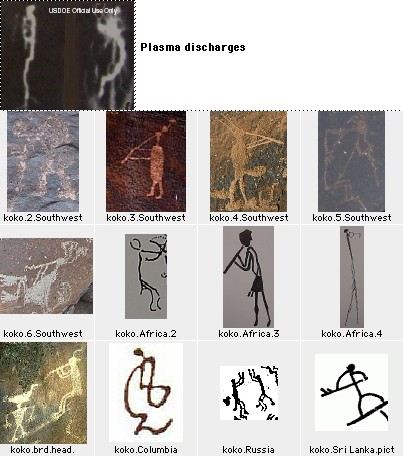
Fig. 37. Kokopelli. Examples from plasma discharges and world-wide interpretations on rock.
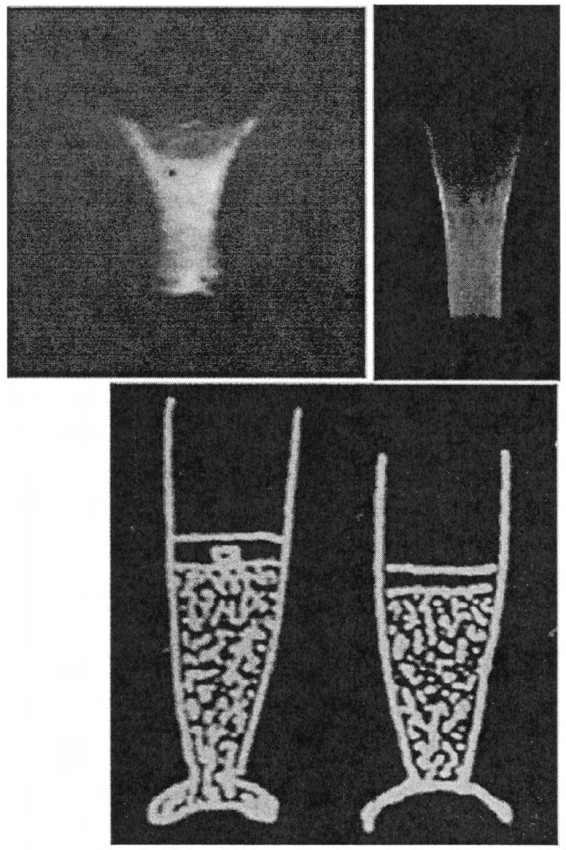
Fig. 38. (Top) Conical inflow of a current conducting plasma column. The flow is from top to bottom. Three important features are already observable: two arm-like shapes at the top of the inflow; striations in the body of the column; and the beginning of a plasma feature at top-center. These experimental photographs pertain to a 5-MV 3-MA plasma. (Bottom) Petroglyphs.
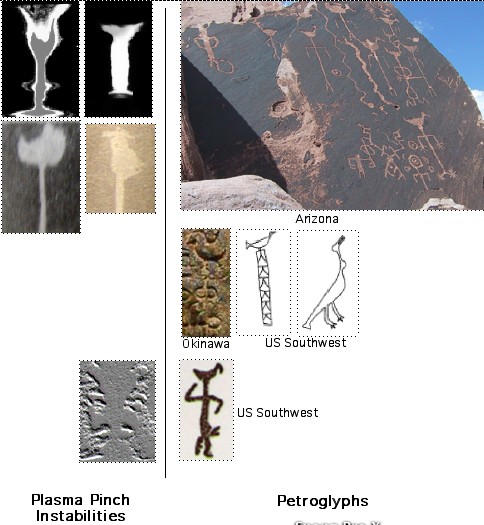
Fig. 39. Experimental data and petroglyphs. (Left) Plasma pinch instabilities. (Right) Petroglyphs relating to birds atop posts and on the heads of man-like figures. The plasma pinch photo at the bottom has been digitally stratified for clarity. The cathode is at the top.
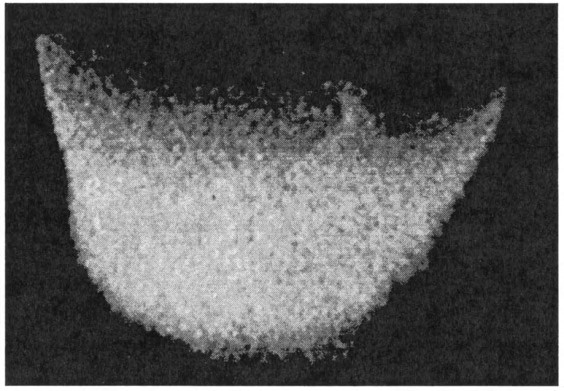
Fig. 40. Experimental plasma photograph of the upper terminus cup of an instability column as shown in Fig. 39, left. This shape can be interpreted to be a duck, a boat, or the body of an animal dependent upon the culture to which the artist belonged. A small perturbation appears two-thirds of the way to the right of this figure. At later times this feature grows into a helical or lightning-like discharge structure.
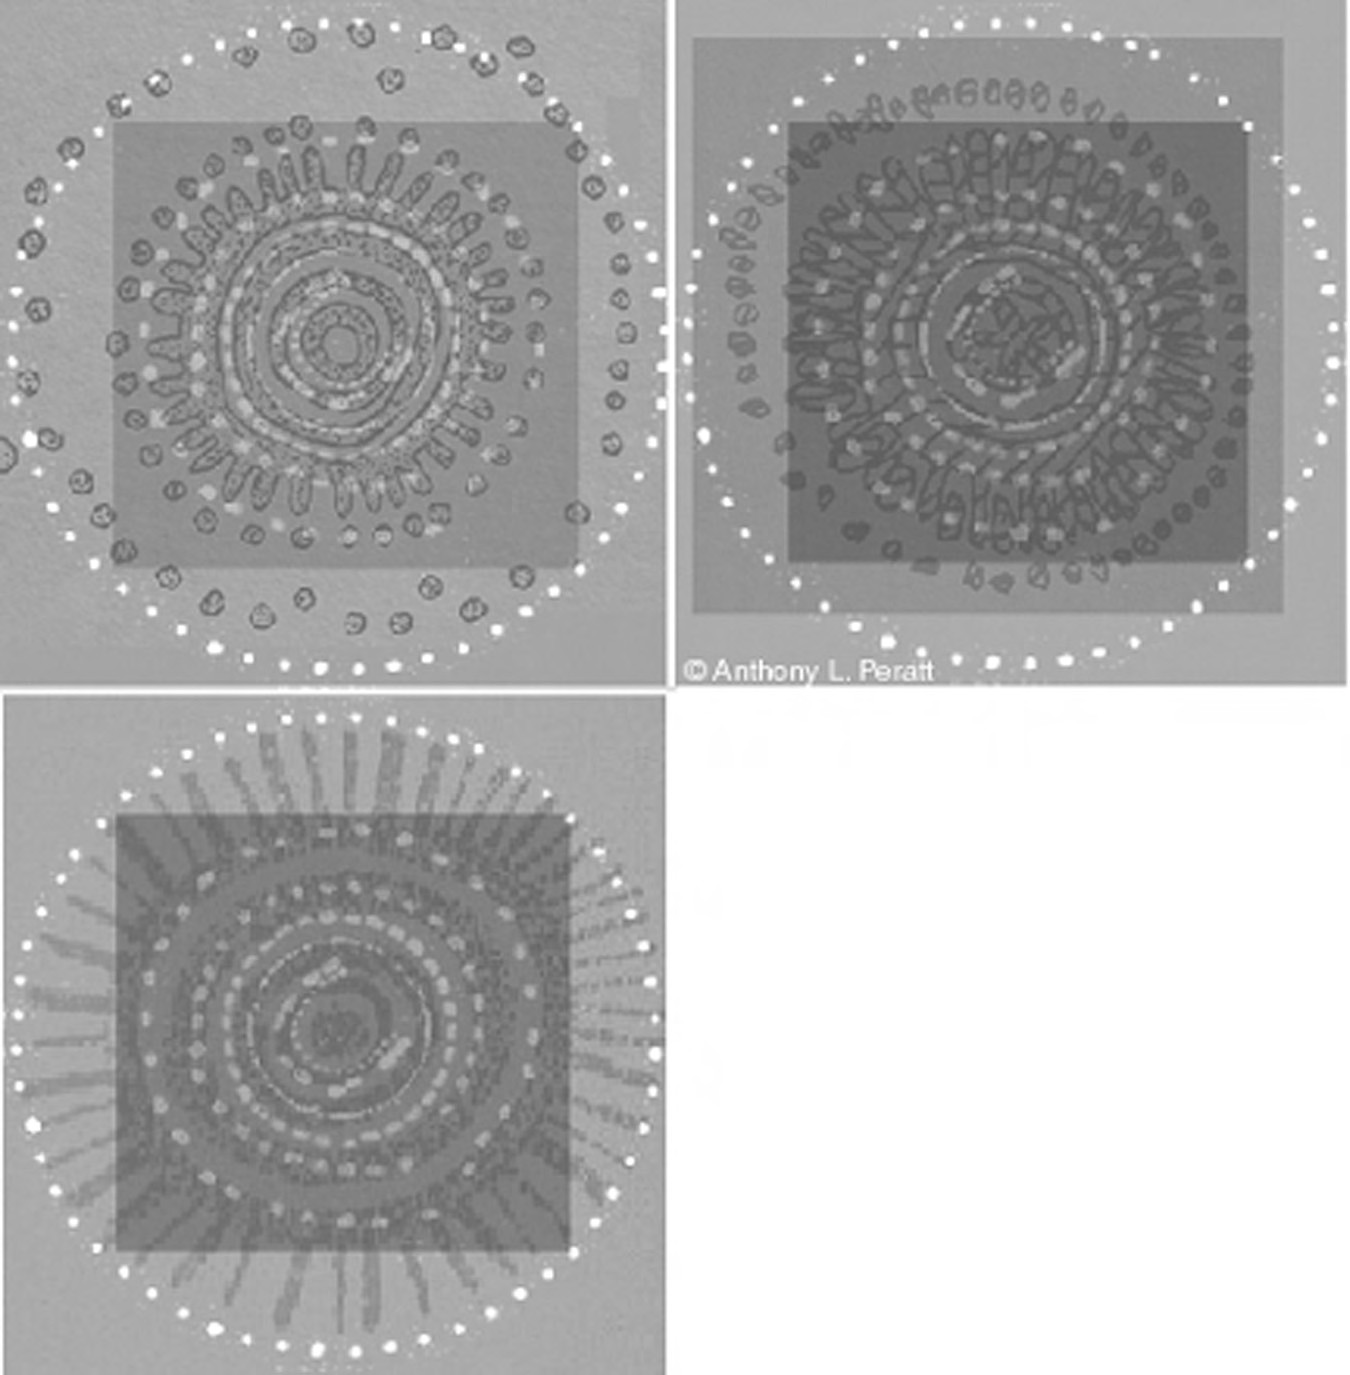
Fig. 46. Overlays of petroglyphs and a pictograph (gray) with a reconstruction image of Stonehenge (white). (Top Left) 4 O’Clock Rapids petroglyph on the Columbia River in the state of Washington. (Top Right) J. D. Bar pictograph, Columbia River. (Bottom Left) Northern Arizona petroglyph. The 4 O’Clock Rapids petroglyph is about 60 cm in diameter while Stonehenge is approximately 100 m in diameter.
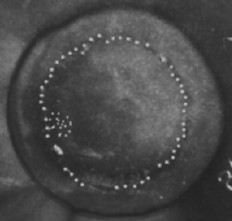
Fig. 45. Steel witness plate with filament hole locations. The hole locations have been digitally enhanced. While the nearly cylindrical beam has a periodicity of 56 holes around the circle, not all of the holes are discernible on the witness plate. Trueness of the ring increases with magnetic field strength. Also recorded on the plate are microcircles of holes within the main ring (e.g, at 8:30, about 1/5 the diameter of the major hole ring) and some beam sheath etching outside the main circle.
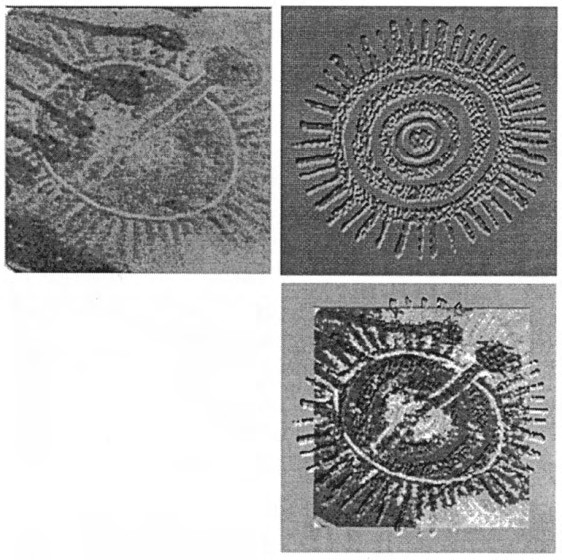
Fig. 47. (Top Left) Windjana pictograph, Australia. (Top Right) Petroglyph, Northern Arizona. (Bottom) Overlay of the Australia and Arizona figures. The gray-white “embossed” figure is the Northern Arizona petroglyph while the Australian pictograph is the “flat” black overlay. The Windjana “ellipse” is fitted to the outer concentric of the Northern Arizona petroglyph.
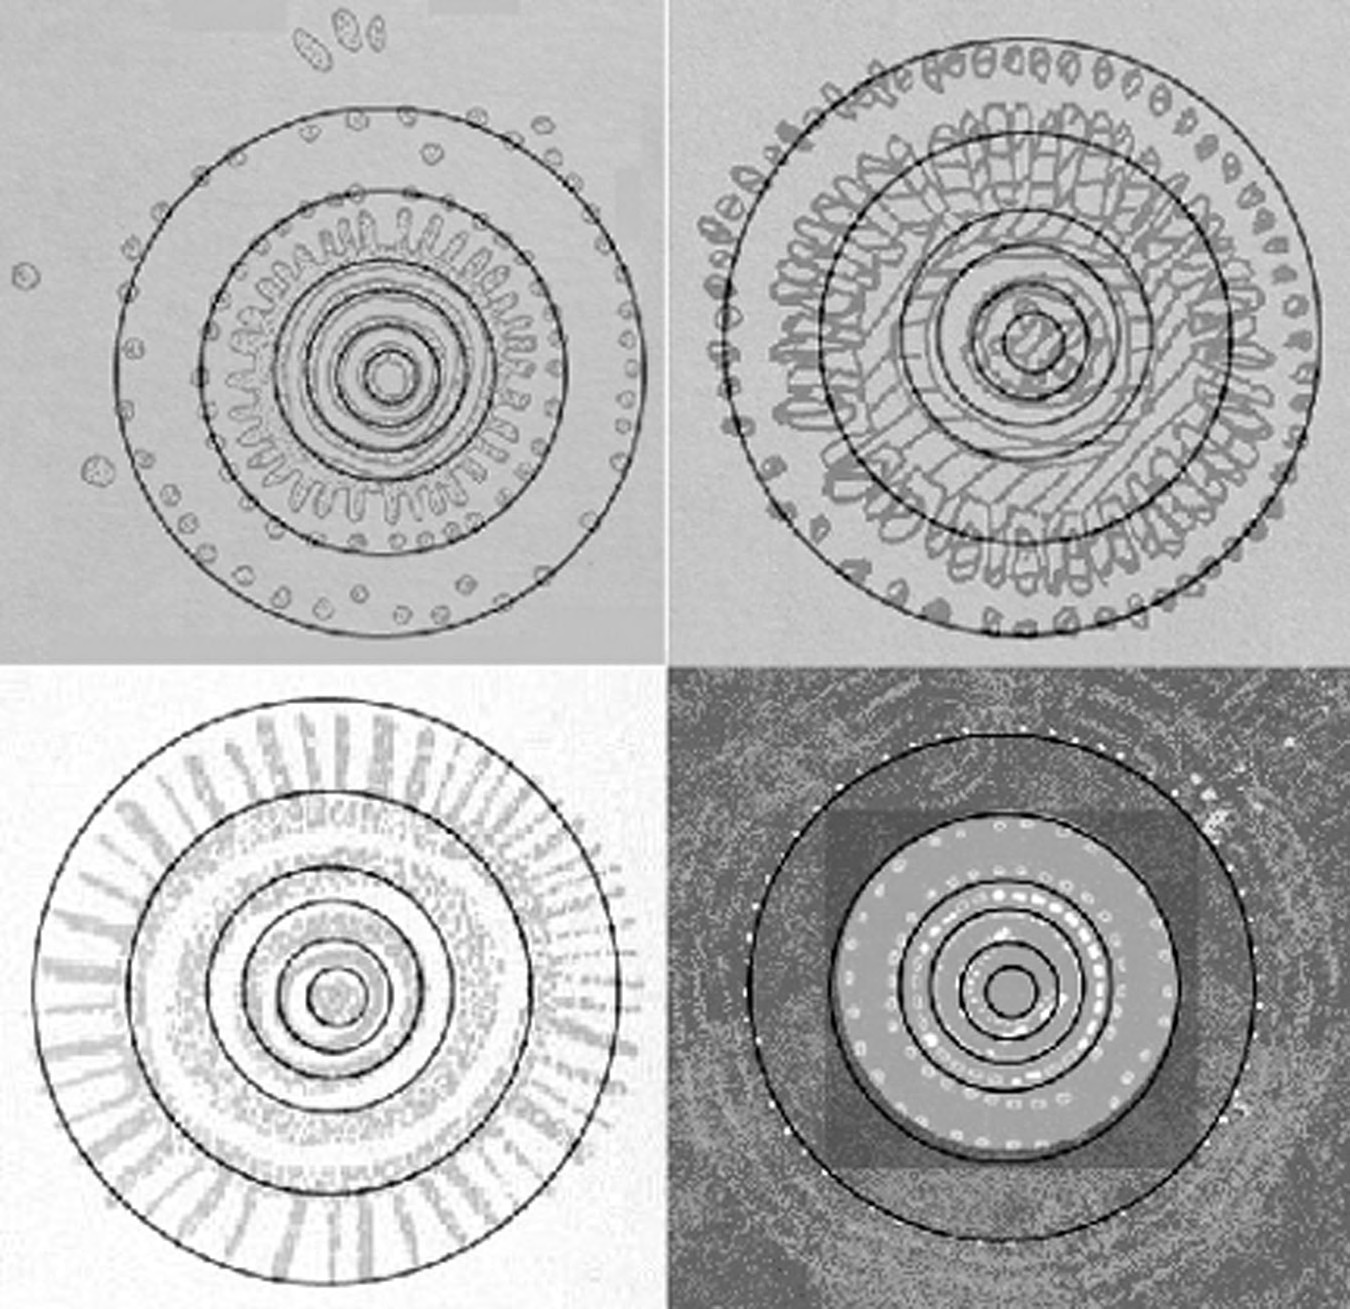
Fig. 48. (Top Left) “Site-34-rings,” the mean average radius of a circle as determined by image-object weighting from the 4 O’Clock Rapids petroglyph on the Columbia River. These 4 O’Clock Rapids (Loring Site 34) rings have been overlaid on the other three images. (Top Right) J. Day Bar pictograph. (Bottom Left) Northern Arizona petroglyph. (Bottom Right) Stonehenge reconstruction image (white dots).
Part Two
From IEEE Transactions on Plasma Science, Vol 35, № 4, August 2007.
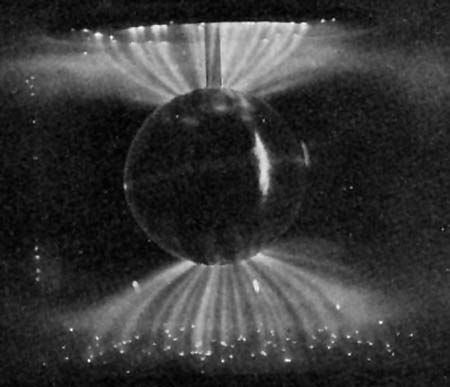
Fig. 57. Birkeland’s 8-cm-diameter copper globe with a discharge current of 10–20 mA. The globe is an anode between two cathode plates in a 320-L vacuum chamber containing 0.013–0.012 mm Hg.
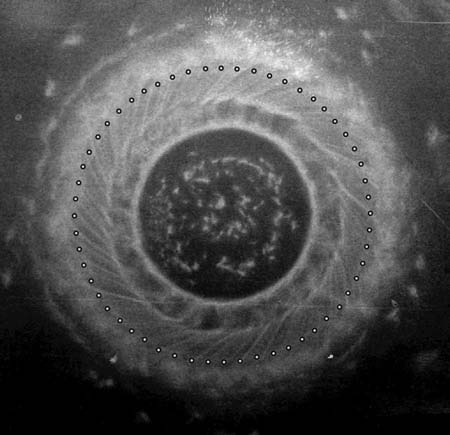
Fig. 59. Penumbra of a DPF from a discharge current of 174 kA. The rotational structure has a periodicity of 56 as shown by the 56-dot overlay pattern.
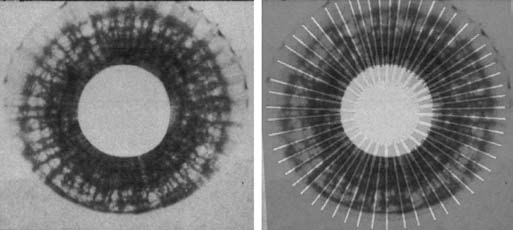
Fig. 60. Penumbra of a 1.8-MA DPF with 56 pairs of filaments as shown by the 56-rayed pattern overlay.
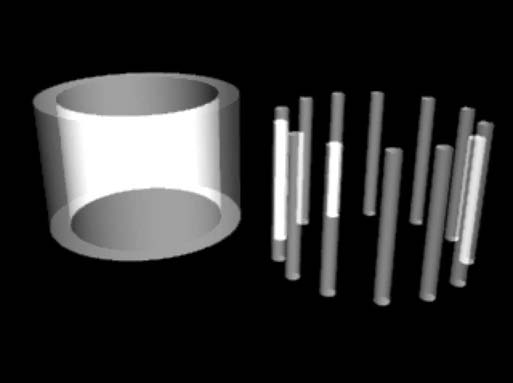
Fig. 61. Basic characteristic of a very thin plasma sheath of relativistic electrons and ions flowing along a longitudinal (vertical) magnetic field; the sheath filaments into 56 current filaments.
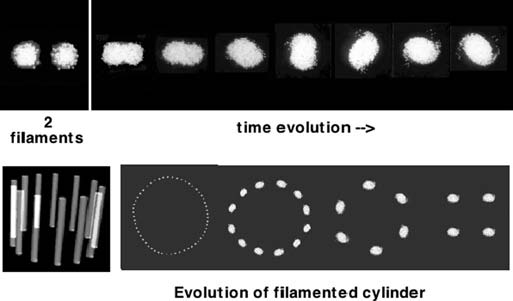
Fig. 62. Top: Particle-in-cell time evolution of two adjacent filaments, as shown by the cross sections of the plasma. Two, and sometimes three, filaments are drawn together to form a vortex structure. Bottom: Rendition of 56 filaments converging to four currents during current increase.
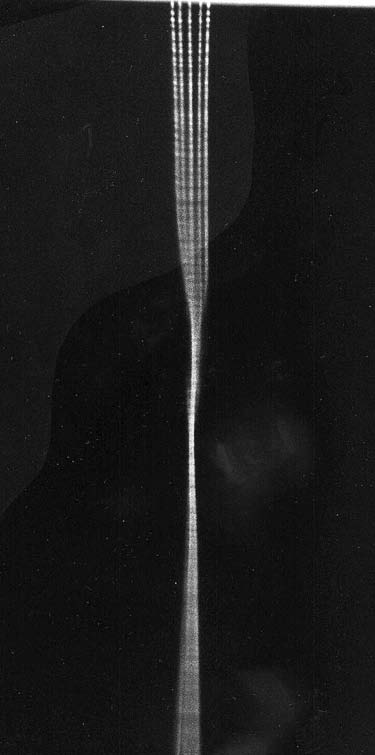
Fig. 63. Streak camera recording with image slit focused across (horizontal direction) six 5-MA current-conducting plasma columns. Time runs from top to bottom, with the columns converging and twisting at the center before separating. Streak photograph by A. L. Peratt, Los Alamos National Laboratory.
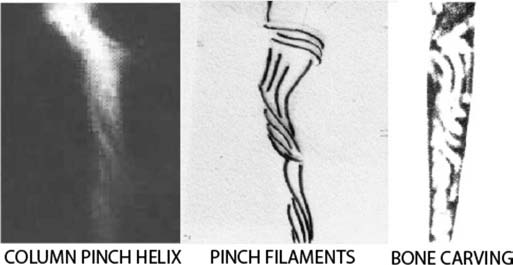
Fig. 64. Left: Single time frame at pinch of six plasma filaments. Center: Helical pattern from line tracing of filaments. Right: Portion of engraved bone from a site in France, presumably from the Magdalenian culture. The section shown is about 1/5 the length of the bone, which is found together with two other bones, display most of the plasma-column instability evolution. Engraved bone photo courtesy of D. Cordova.
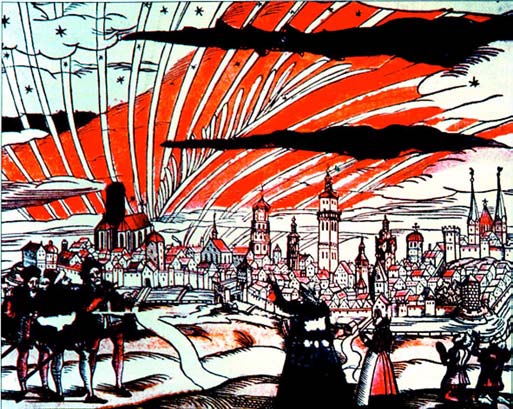
Fig. 65. Red auroras were considered a sign of ill omens during medieval times and pilgrimages were organized to avert the wrath of Heaven. Brilliant displays have frightened people as recently as this century in regions where aurora sightings are rare (courtesy of Zentral Bibliothik, Zurich: from S.-I. Akasofu).
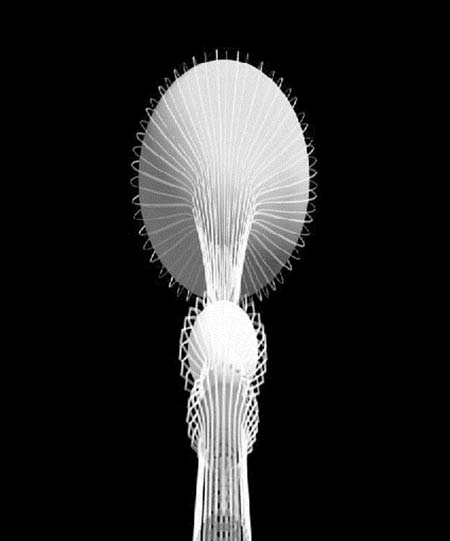
Fig. 66. Virtual image of the intense auroral plasma column as determined from FOV directivity, viewing angle of inclination, and GPS surveys of worldwide petroglyph “pixels.” Not to scale.
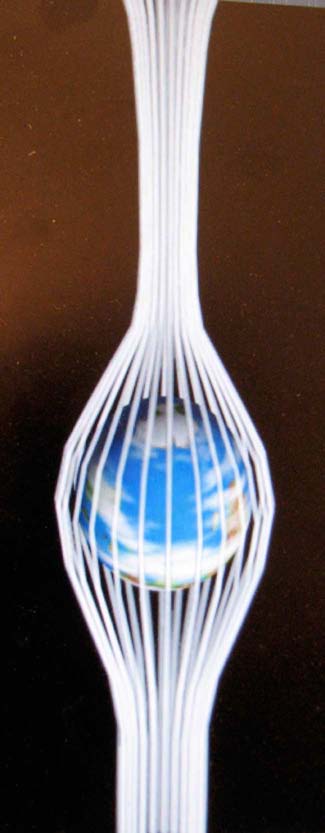
Fig. 67. Conceptual view of the Birkeland sheath filaments surrounding Earth (28 close pairs). The relativistic electron flow is downwards toward Antarctica. As shown in Figs. 63 and 64, the current bundle above Antarctica twists in counter-clockwise rotation. By convention, the Birkeland currents and ion flow is upwards toward the Arctic. Not yet completely resolved is a bend in the upper filament sheath that allows the upper plasmoids and column to be seen at northern latitudes.
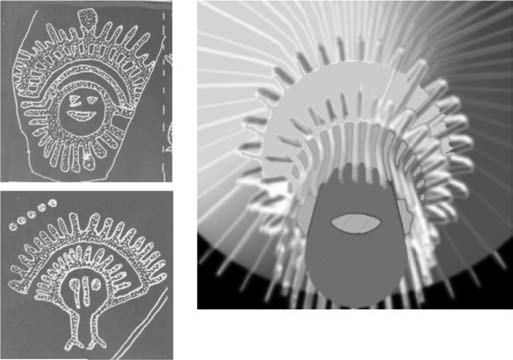
Fig. 68. Left: Northern hemisphere petroglyphs from the Columbia River Basin, 45.65° N, 121.95° W. Right: Oblique view into the auroral plasma column from these coordinates.
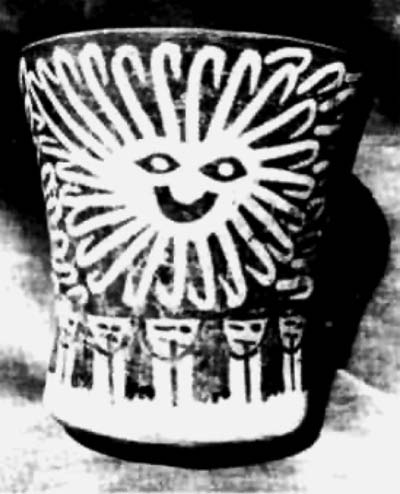
Fig. 69. Nasca, Peru vase, date unknown (14.24° S, 75.58° W). Note the similarity to the northern hemisphere petroglyphs (Fig. 68, left).
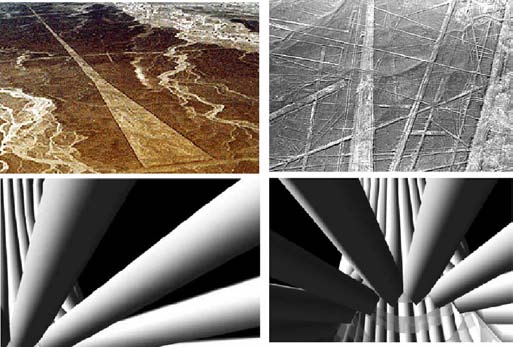
Fig. 71. Top: Trapezoids and lines of the Palpa and Nasca plains. Bottom: View upwards into Fig. 67 from a “camera” placed at the surface of the digital Earth at latitude/longitude 14.24° S, 75.58° W. The historical terms “swords”, “spears”, “white vapor”, “like glossed silk penetrating it”, and “candles in the sky”, appear appropriate to these pictures.
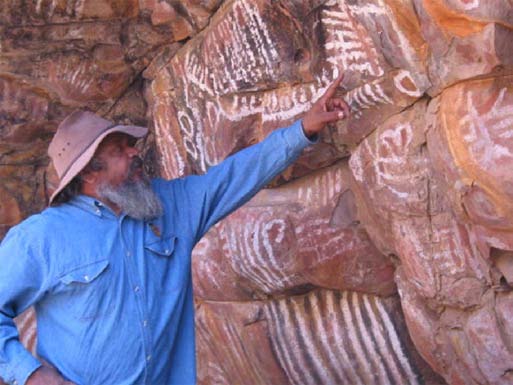
Fig. 72. White-striped pictographs at Iga Warta Cultural Tourism Centre, North Flinders Range (30.59° S, 138.94° E). Shown is Cliff Coulthard, Australian Department of Environment and Planning in Aboriginal Heritage, an authority on pictograph painting techniques having analyzed such works as the Magdalenian cave art in France.
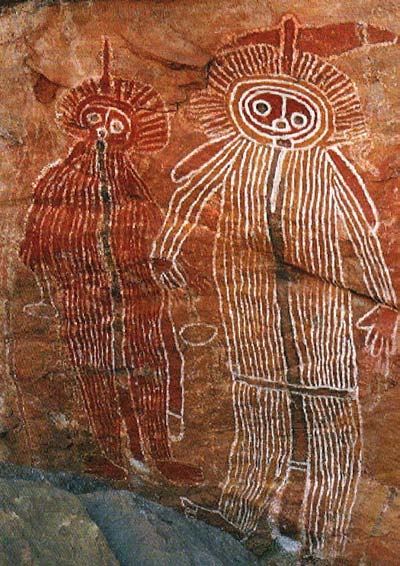
Fig. 73. Lightning Brothers, Ingaladdi, Victoria River, Wardaman country of the Northern Territory (15° S, 130° E). New dating techniques of this red inorganic-pigmented pictograph image were done using a plasma-chemical extraction method.
I’ll quote David Talbott to give a glimpse of the implications of these papers, if they are correct.
If Peratt’s conclusions are correct, then only a few thousand years ago the terrestrial sky was ablaze with electrical activity. The ramifications of this possibility will directly affect our understanding of cultural roots. What was the impact of the recorded events on the first civilizations? What was the relationship to the origins of world mythology, to the birth of the early religions, or to monumental construction in ancient times?
There is reason to believe that rock art will illuminate a critical turn in human history. There is also a provable connection to the evolution of mythical archetypes. Archaic rock art depictions came first, but were followed by an outpouring of conceptual elaborations, as ancient artists gave imaginative expression to the celestial forms and events that inspired the myth-making epoch. Both the rock artists and the myth-makers had true perils on their minds. The rock artists recorded and the myth-makers interpreted electrical events in the sky, as plasma discharge sequences moved through discrete phases, some of celestial beauty, others intensely violent and terrifying.
-
![[PDF]](https://www.eixdelmon.com/wp-content/plugins/papercite/img/pdf.png) A. L. Peratt, “Characteristics for the Occurrence of a High-Current Z-Pinch Aurora as Recorded in Antiquity,” IEEE Transactions on Plasma, vol. 31, iss. 6, 2003.
A. L. Peratt, “Characteristics for the Occurrence of a High-Current Z-Pinch Aurora as Recorded in Antiquity,” IEEE Transactions on Plasma, vol. 31, iss. 6, 2003.
[Bibtex]@Article{peratt2003, Title = {Characteristics for the Occurrence of a High-Current Z-Pinch Aurora as Recorded in Antiquity}, Author = {Anthony L. Peratt}, Journal = {IEEE Transactions on Plasma}, Year = {2003}, Month = {December}, Number = {6}, Volume = {31}, File = {peratt2003.pdf:peratt2003.pdf:PDF}, Keywords = {aurora,high-energy-density plasma,magnetohydrodynamics}, Owner = {trismegisto}, Timestamp = {2015.11.02} } - A. L. Peratt, “Characteristics for the Occurrence of a High-Current Z-Pinch Aurora as Recorded in Antiquity Part II: Directionality and Source,” IEEE Transactions on Plasma, vol. 35, iss. 4, 2007.
[Bibtex]@Article{peratt2007, Title = {Characteristics for the Occurrence of a High-Current Z-Pinch Aurora as Recorded in Antiquity Part II: Directionality and Source}, Author = {Anthony L. Peratt}, Journal = {IEEE Transactions on Plasma}, Year = {2007}, Month = {August}, Note = {Other authors: John McGovern, Alfred H. Qöyawayma, Marinus Anthony Van der Sluijs, Mathias G. Peratt}, Number = {4}, Volume = {35}, File = {peratt2007.pdf:peratt2007.pdf:PDF}, Keywords = {Archaeoastronomy, aurora, dense plasma focus (DPF), global information systems, magnetohydrodynamic (MHD) instability, petroglyph, plasma, plasma universe, Z-pinch}, Owner = {trismegisto}, Timestamp = {2015.11.02} } - D. N. Talbott, The Saturn Myth, Doubleday, 1980.
[Bibtex]@Book{TalbottDavidTheSaturnMyth1980, title = {The Saturn Myth}, publisher = {Doubleday}, year = {1980}, author = {David N Talbott}, note = {1. This version fully reformatted for eBook devices, specifically Kindle, with endnotes and internal references fully hyperlinked. 2. To convert to other formats use Calibre eBook Management software, available to download free. 3. 1st revision August 2013. 2nd Revision Nov 2014 (filetype changed to .azw3, checked \& fixed non-functional hyperlinks \& minor corrections). Final revision Feb 2015 (minor corrections throughout \& all hyperlinks checked).}, file = {TalbottDavidTheSaturnMyth1980.azw3:media/trismegisto/Vitamin/Documents/Bibliography/TalbottDavidTheSaturnMyth1980.azw3:Amazon Kindle;TalbottDavidTheSaturnMyth1980.epub:media/trismegisto/Vitamin/Documents/Bibliography/TalbottDavidTheSaturnMyth1980.epub:ePUB}, owner = {trismegisto}, review = {Intrigued by Velikovsky’s claim that Saturn was once the pre-eminent planetary god, David Talbott resolved to examine its mythical character. “I wanted to know,” he wrote, “if ancient sources had a coherent story to tell about the planet . . . I had no inkling of the spectacular tale hidden in the chronicles.” In this startling re-interpretation of age-old symbolism Talbott argues that the “Great God” or “Universal Monarch” of the ancients was not the sun, but Saturn, which once hung ominously close to the earth, and visually dominated the heavens. Talbott’s close textual and symbolic analysis reveals the fundamental themes of Saturn imagery and proves that all of them—including the “cosmic ship”, the “island at the top of the world”, the “eye of heaven” and “the revolving temple” were based on celestial observations in the northern sky. In addition he shows how such diverse symbols as the Cross, “sun”-wheels, holy mountains, crowns of royalty and sacred pillars grew out of ancient Saturn worship. Talbott contends that Saturn's appearance at the time, radically different from today, inspired man's leap into civilization, since many aspects of early civilization can be seen as conscious efforts to re-enact or commemorate Saturn’s organization of his “celestial” kingdom. A fascinating look at ancient history and cosmology, The Saturn Myth is a provocative book that might well change the way you think about man’s history and the history of the universe.}, timestamp = {2016.01.22}, url = {https://archive.org/details/TalbottDavidTheSaturnMyth1980} } - M. A. van der Sluijs, The Mythology of the World Axis; Exploring the Role of Plasma in World Mythology, All-Round Publications, 2007.
[Bibtex]@Book{vandersluijsmythology2007, Title = {The Mythology of the World Axis; Exploring the Role of Plasma in World Mythology}, Author = {Marinus Anthony van der Sluijs}, Publisher = {All-Round Publications}, Year = {2007}, Abstract = {Towards the end of the Stone Age, the sky was ablaze with awe-inspiring forms not seen today. Dominant among these was a towering, life-like pillar of light stretching from near the horizon to high up into space - the tree of life, the world mountain, the ladder to heaven. This message is heard in virtually every ancient society on earth, but while this 'world axis' is familiar enough to scholars, little sense could be made of the stories. The most conspicuous feature of the ancient cosmologies also remained the most elusive. From a modern scientific perspective, such traditional accounts no longer sound preposterous. Our growing knowledge of devastating events in recent earth history substantiates the possibility that prehistoric people witnessed a violent and prolonged display of high-energy auroras. This colourful book is an edited slideshow intended as an accessible 'appetiser' for a forthcoming monograph about traditions of the world axis.}, Owner = {trismegisto}, Timestamp = {2016.01.18}, Url = {http://www.mythopedia.info/books.html} } - M. A. van der Sluijs, The World Axis as an Atmospheric Phenomenon, All-Round Publications, 2007.
[Bibtex]@Book{vandersluijsworldaxis2007, Title = {The World Axis as an Atmospheric Phenomenon}, Author = {Marinus Anthony van der Sluijs}, Publisher = {All-Round Publications}, Year = {2007}, Abstract = {Cultural anthropologists often use the term axis mundi in a looser sense than the strict astronomical one. This poses a problem, because the objects they identify as ‘axis mundi’ in mythological and early cosmological sources do not correspond to the present state of the axis of the earth. The association of these objects with the axis of the earth does not appear to have been made explicitly and unambiguously before the 1st millennium BCE, probably because the rotation of the earth around its axis was not commonly known in earlier times. By contrast, the mythological phenomenon loosely identified as the axis mundi dates back to the earliest stages of civilisation and is described by the most diverse cultures in remarkably similar terms. It can be explained by reference to a once visible entity in the sky, with a complex, evolving morphology and a possible link to the zenith or the pole. The prototype may have been the zodiacal light or, as recent insights in plasma physics indicate, an enhanced aurora formed in prehistoric times.}, Owner = {trismegisto}, Timestamp = {2016.01.18}, Url = {http://www.mythopedia.info/books.html} }
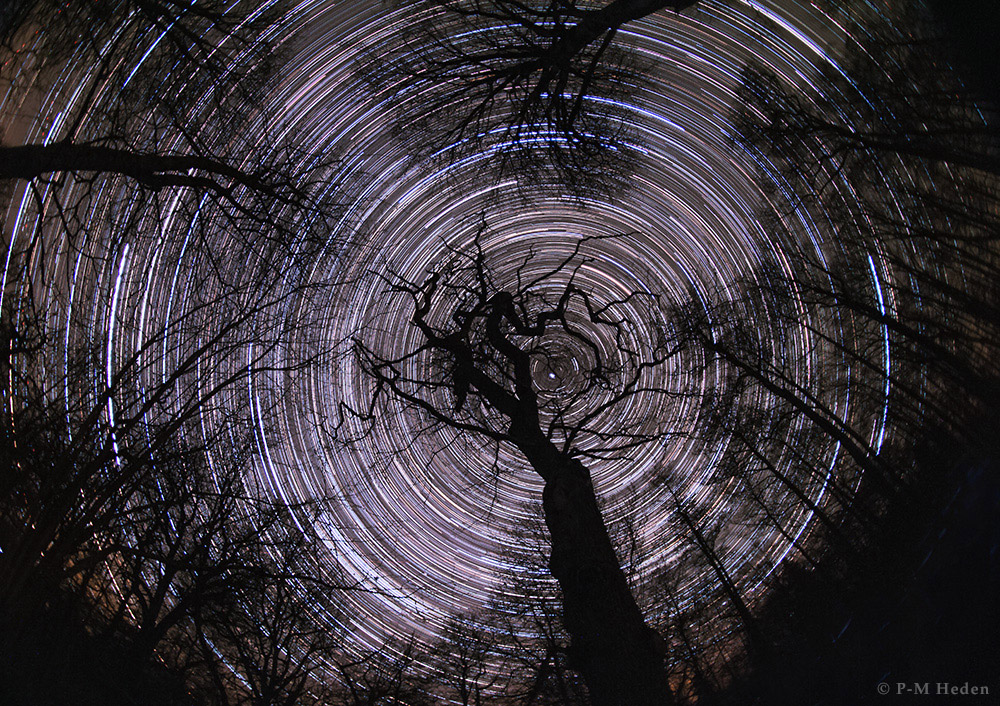
The rotating sky above old oak trees in Sweden. The Polaris, the north star, appear near the center of the star trails is almost aligned with the Earth rotation axis and marks the north celestial pole. P-M Heden, Clearskies.se